How to Use the Analytics Dashboard
The Analytics dashboard helps you understand how visitors interact with your knowledge base. It provides insights into article performance, visitor activity, and search behavior so you can identify what content is working well and where improvements may be needed.
With analytics, you can see:
How many people are visiting your help center
Which articles are being viewed the most
What visitors are searching for
How helpful your articles are to users
How to Access the Analytics Dashboard
To open the analytics dashboard:
Go to your HelpSite admin dashboard.
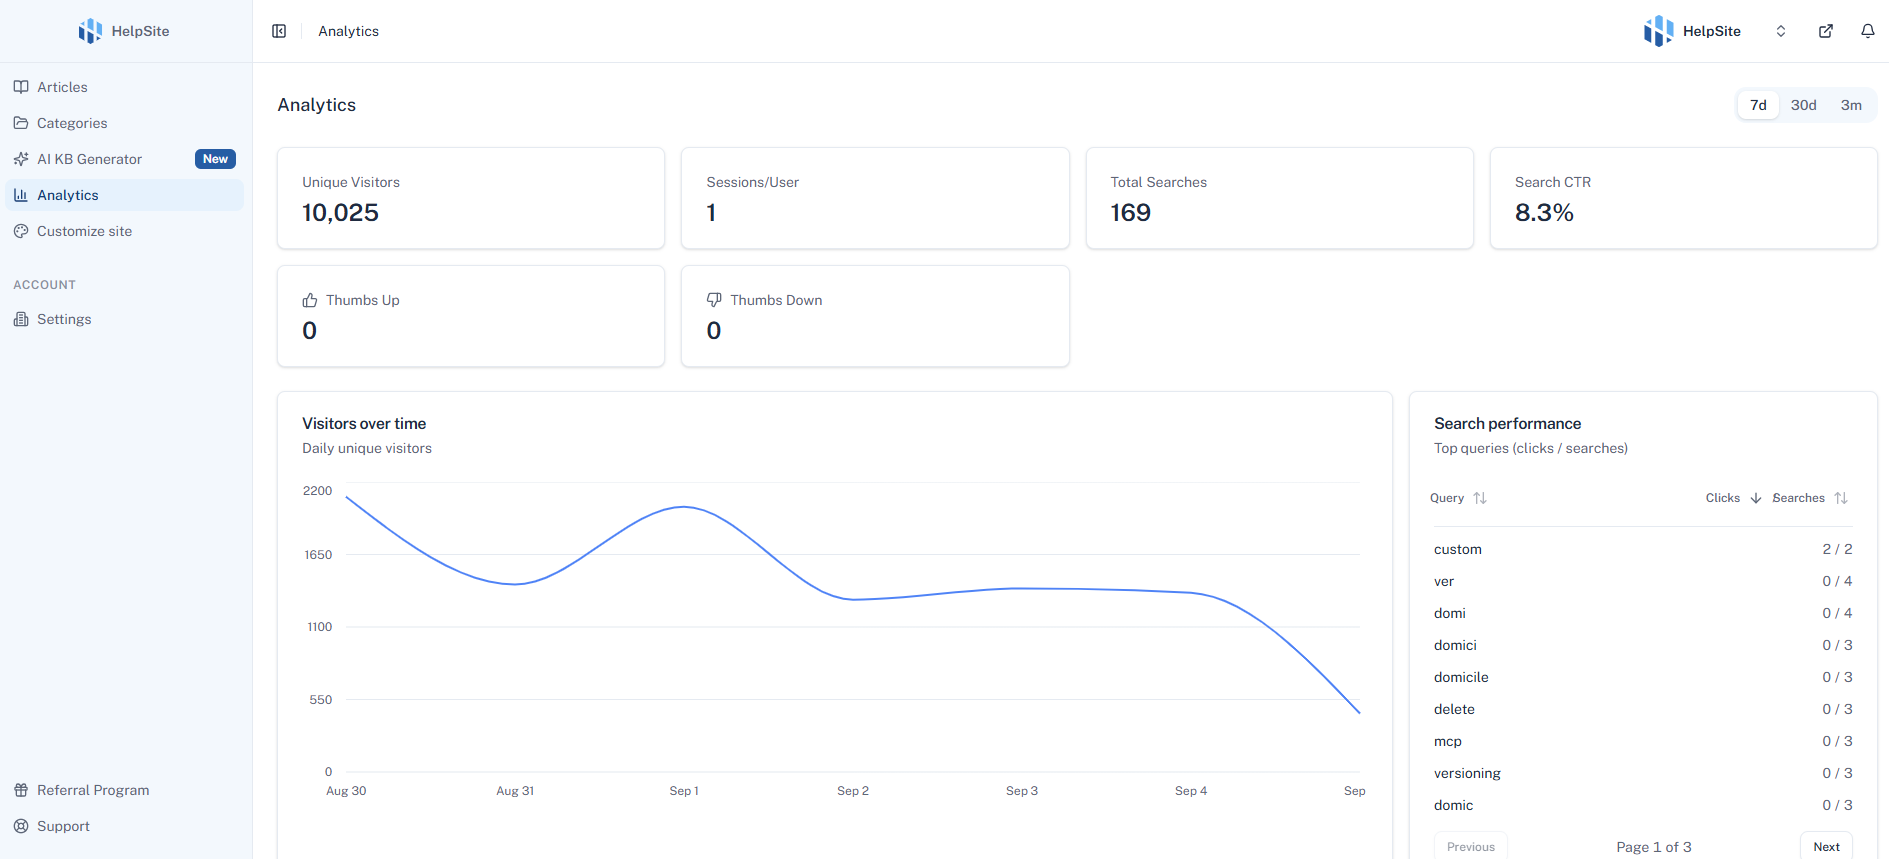
Click Analytics in the left navigation menu.
The dashboard will display an overview of your help center activity.
How to Filter Analytics by Time Range
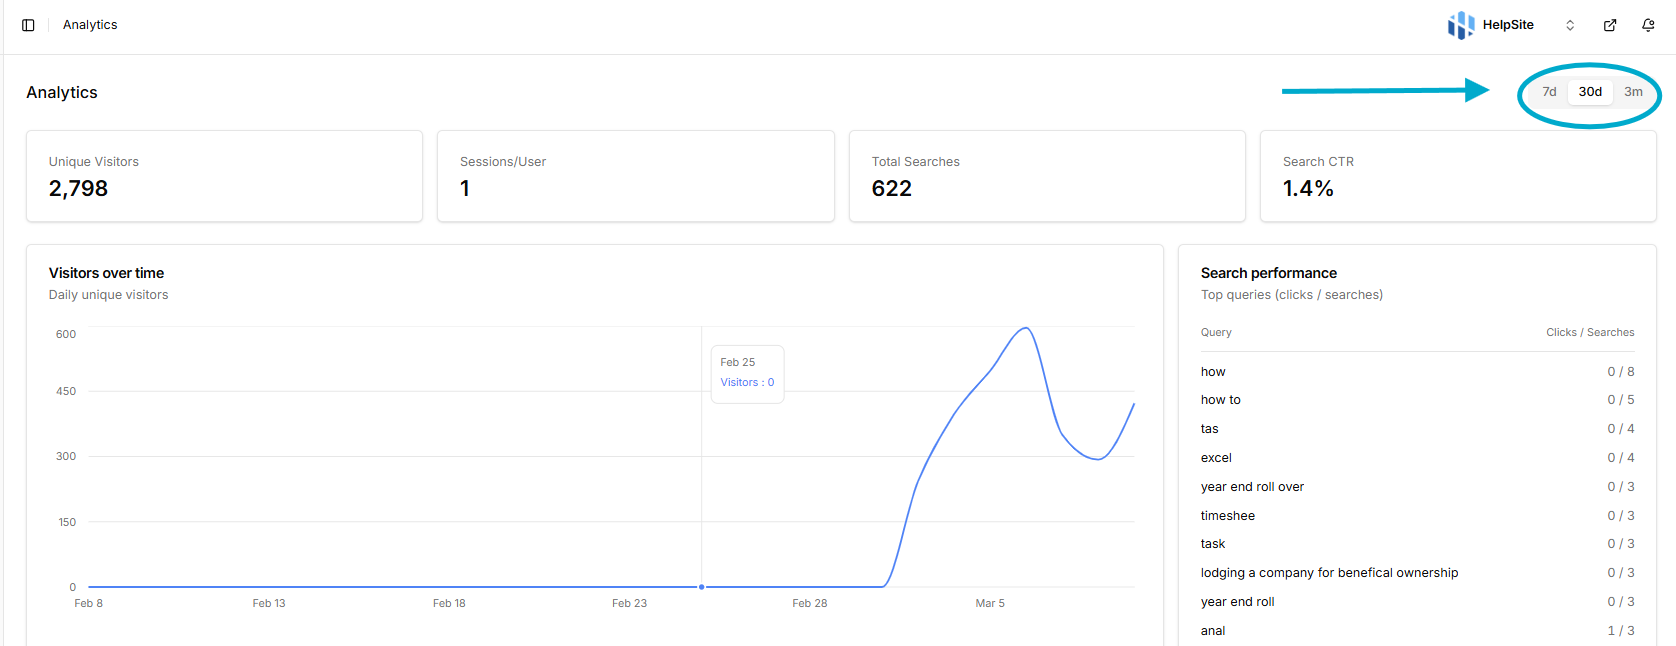
You can adjust the time range to view analytics data from different periods.
Available options include:
Last 7 days
Last 30 days
Last 3 months
When you change the time range, all dashboard metrics, charts, and article data will update automatically.
How to Read the Analytics Metrics
The dashboard displays several key metrics that summarize visitor activity.
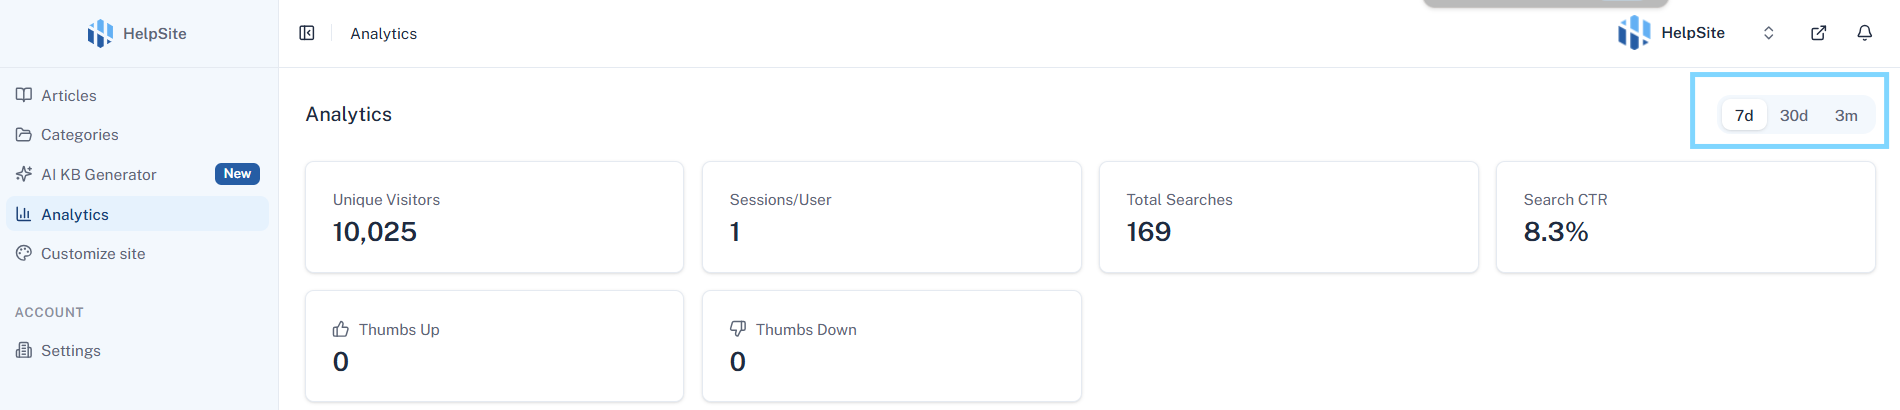
Unique Visitors
Shows the number of individual people who visited your help center during the selected time period.
Each visitor is counted once, even if they view multiple articles.
Sessions per User
Shows how many browsing sessions the average visitor has during the selected time range.
Higher numbers may indicate that visitors return to your help center multiple times.
Total Searches
Shows how many times visitors used the search function in your help center.
This can help you understand how often users rely on search to find answers.
Search CTR
Search CTR (Click-Through Rate) shows the percentage of searches that resulted in a user clicking on an article.
A higher CTR suggests that users are finding relevant results from search.
How to Understand the Visitor Trend Chart
The visitor trend chart shows how visitor activity changes over time.
Each point on the chart represents the number of visitors for a specific day within the selected time range.
This can help you identify patterns such as:
Increases in help center traffic
Spikes after product updates
Seasonal usage trends
How to View Article Performance
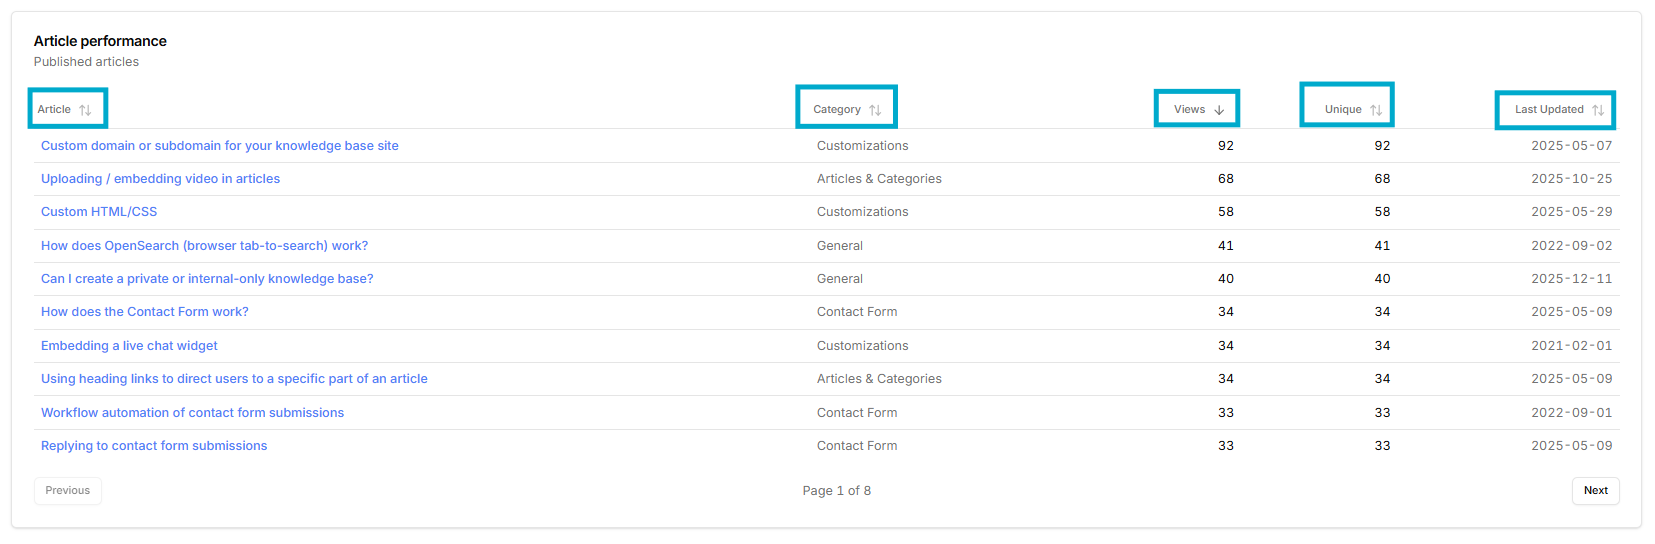
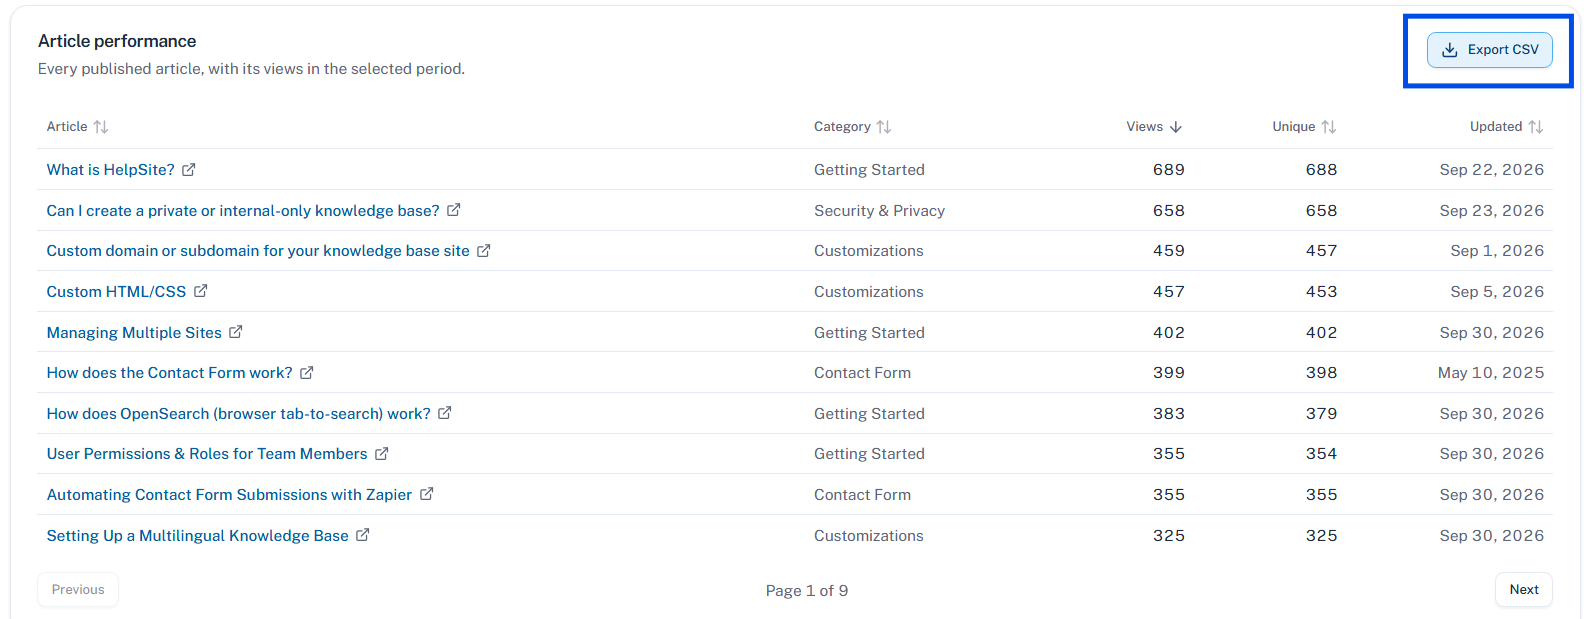
The article table shows performance data for all published articles in your help center.
For each article, you can see:
Article name
Category
Views
Unique visitors
Helpfulness percentage
Last updated date
This helps you identify which articles are performing well and which may need improvement.
How to Sort Article Data
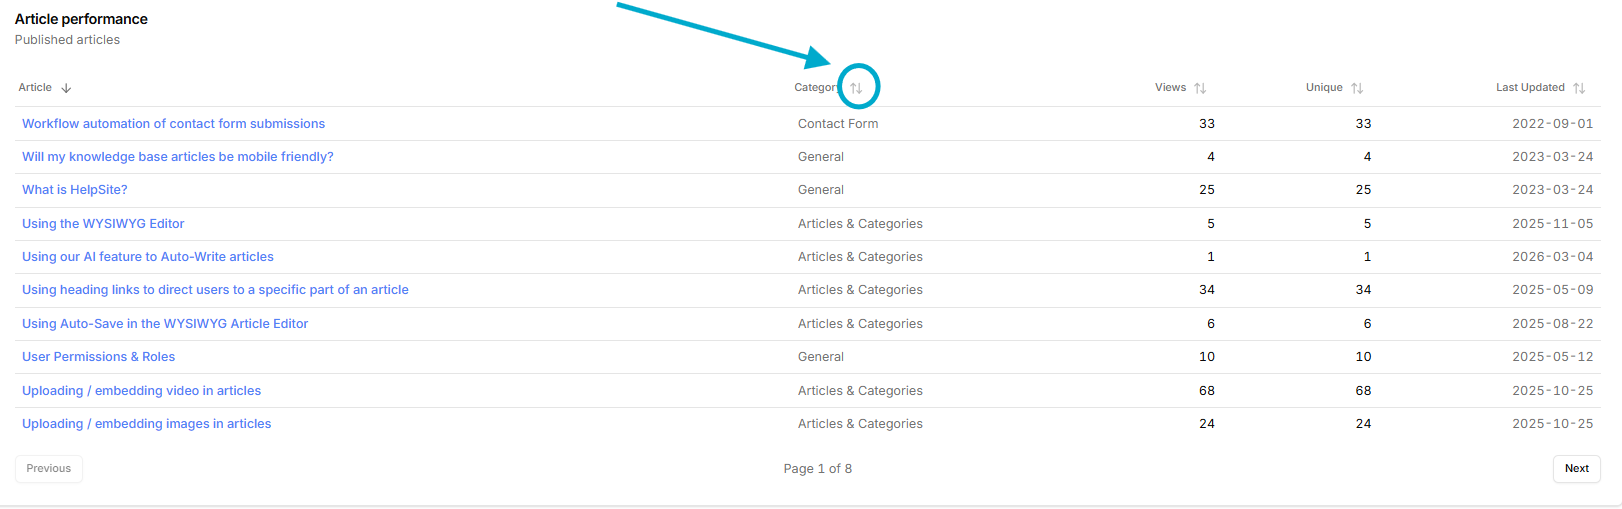
You can sort the article table to quickly find the information you need.
You can sort by:
Article name
Category
Views
Unique visitors
Helpfulness
Last updated
Sorting works in both ascending and descending order.
How to Compare Analytics to a Previous Period
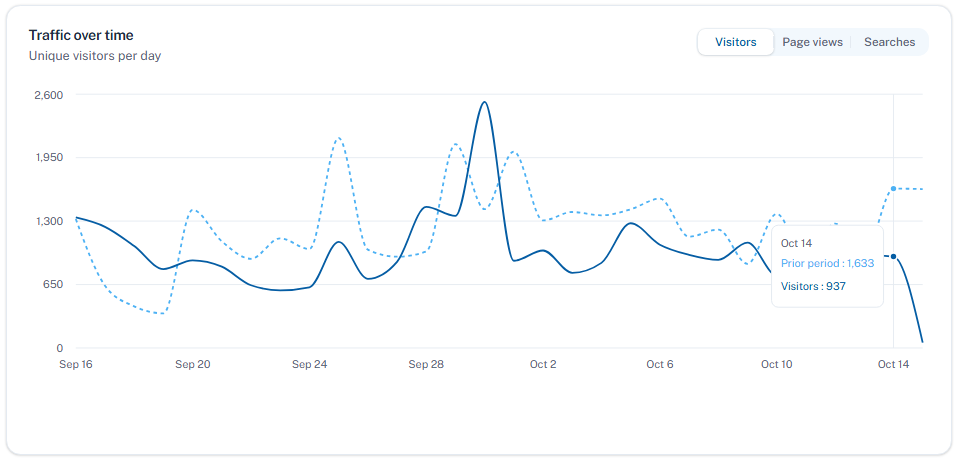
The dashboard now shows how your metrics are performing compared to the same length of time before your selected range.
Each metric card displays a percentage change next to the current number. A green indicator means the number improved. A red indicator means it went down.
If you select Last 30 days, the comparison is automatically made against the 30 days before that. This works for all date ranges.
How to Switch the Chart Metric
By default, the visitor trend chart shows Unique Visitors over time. You can switch it to show Page Views or Searches instead.
To change the metric:
Look for the metric toggle above the chart.
Select Visitors, Page Views, or Searches.
The chart updates instantly.
How to Find Content Gaps
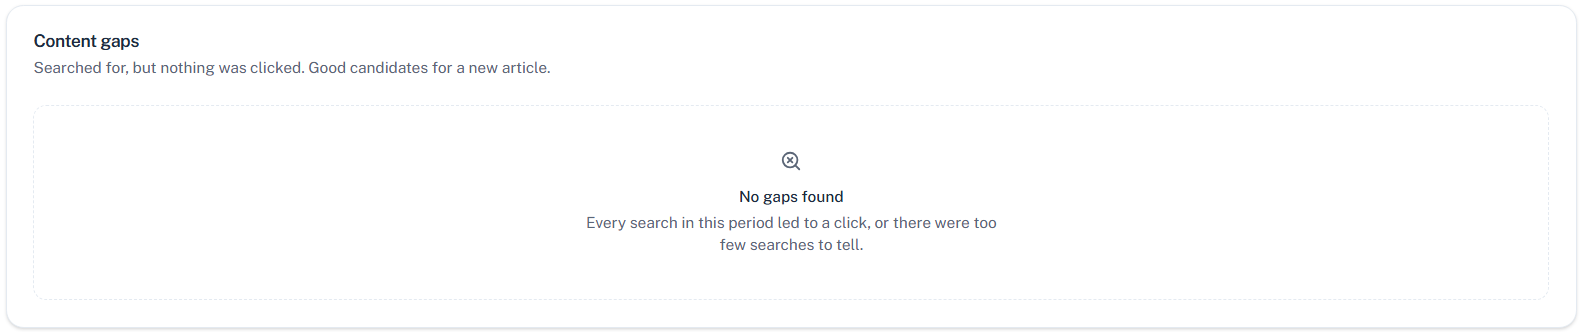
The Content Gaps section shows search queries that visitors typed but did not click any result for. These are topics your visitors are looking for that your knowledge base is not currently answering well.
You can find this in the Search Performance section of the dashboard. Use this list to decide which new articles to write or which existing ones need to be improved.
How to Export Analytics Data
You can download the article and search performance tables as CSV files.
To export:
Scroll to the table you want to export.
Click Export CSV above the table.
The file will download to your computer.
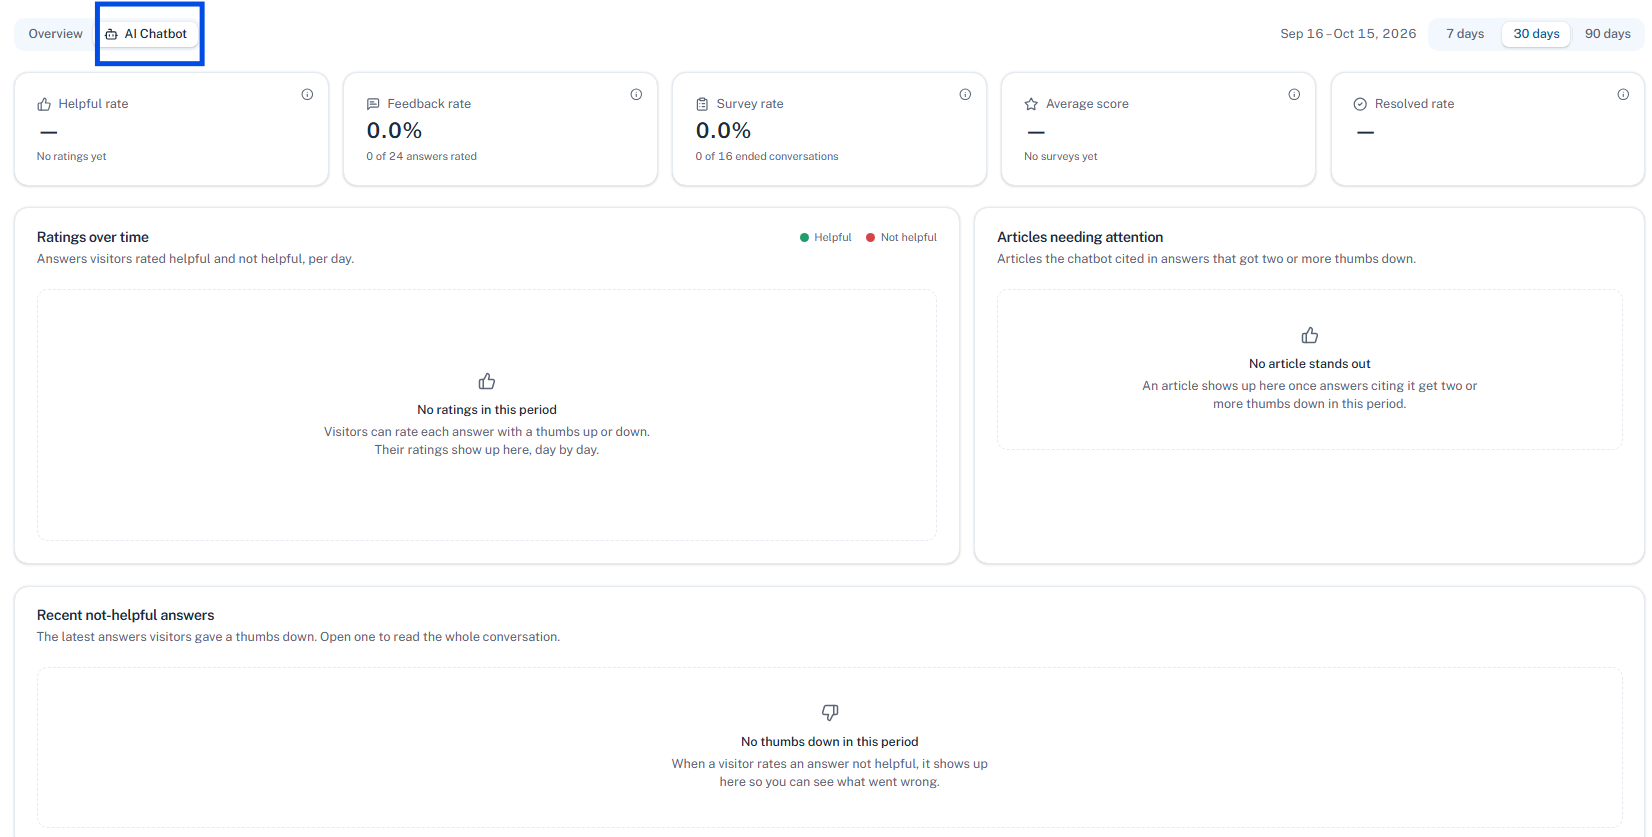
How to View AI Chatbot Conversations
If your site has the AI Chatbot enabled, there is a dedicated AI Chatbot tab in Analytics where you can browse all visitor conversations.
To access it:
Go to Analytics in the left navigation.
Click the AI Chatbot tab at the top.
From here you can:
See a list of all conversations, including when they started, which page the visitor was on, and their first question
Click any conversation to open the full thread with the visitor’s questions, the bot’s answers, and the articles cited as sources
Search conversations by keyword
Filter by date range